
Business analysis is a form of planning, researching, predicting, and evaluating business or business activities. The goal is to identify potential risks that may arise when running a business so that they can be anticipated and profits and main objectives can be increased. Pangasius fish farming also requires precise analytical calculations to determine its feasibility.
1. Production cost analysis
To calculate the total cost (TC), one obtains it by adding the fixed costs (FC) and the variable costs (VC) using the formula:
TC = FC + VC
Information:
TC = Total cost (IDR)
FC = Fixed cost (IDR)
VC = Variable cost (IDR)
2. Revenue analysis
The calculation of total revenue (TR) is the product of the amount of production (Y) and the selling price (Py) and is expressed by the formula:
TR = Py. Y
Information:
TR = Total revenue (IDR)
Py = Product price (IDR)
Y = Production quantity (g)
3. Income analysis
Revenue is obtained from the difference between total revenue (TR) and total cost (TC) and is expressed by the formula:
I = TR – TC
Information:
I = Income (IDR)
TR =Total revenue (IDR)
TC = Total cost (IDR)
4. R/C analysis
R/C is the ratio between revenue and total cost
Information:
R/C = Revenue/Cost
TR = Total revenue (IDR)
TC = Total cost (IDR)
There are three criteria in the calculation, namely:
- If the R/C > 1 means that the farm is profitable.
- If R/C = 1, it means that the farm is breaking even.
- If R/C < 1, it means that the farm is losing.
5. Analysis of B/C
The benefit-cost ratio is an analytical tool used to measure the level of feasibility in the production process of farming.
(B/C) =
Information:
B/C = Benefit/Cost
B = Benefit (IDR)
C = The amount of expenses incurred (in Indonesian Rupiah)
There are three criteria in the calculation:
- If the B/C Ratio > 0, then the business being run is profitable or feasible to be developed.
- B/C Ratio < 0, then the business suffers a loss or is not feasible to develop.
- If the B/C Ratio = 0 then the business is at the break-even point (Break Even Point).
6. Break-even point
The break-even point can be written in terms of production and price with the equation:
BEP Production =
BEP Price =
Information:
VC = Total variable cost
(IDR/Siklus/kg)
P = Selling price/kg
(IDR/kg)
Y = Production quantity (kg)
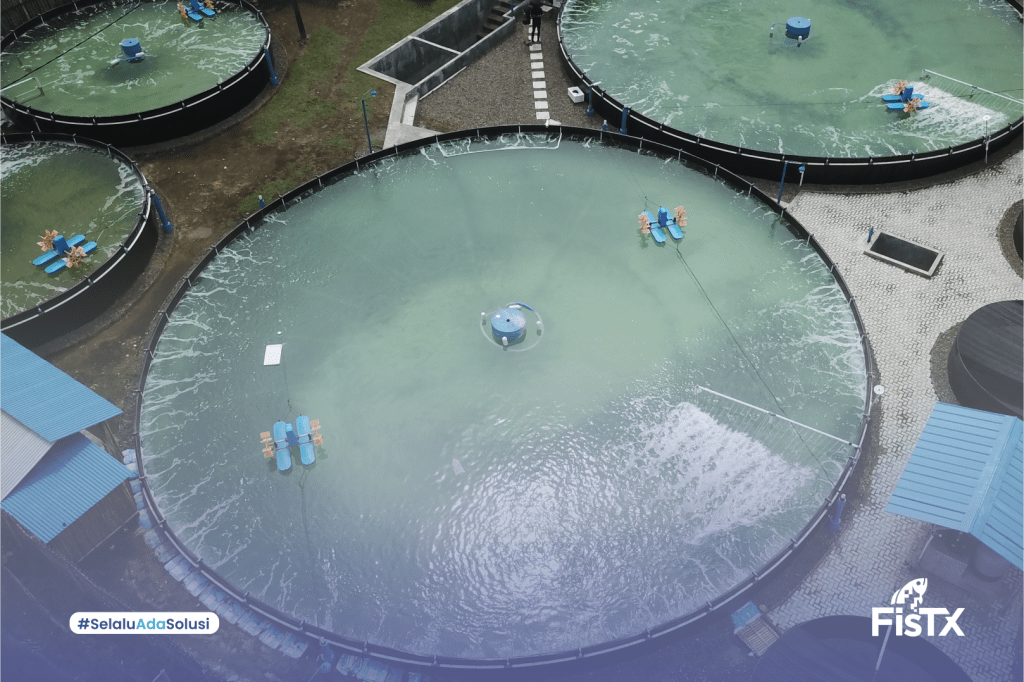
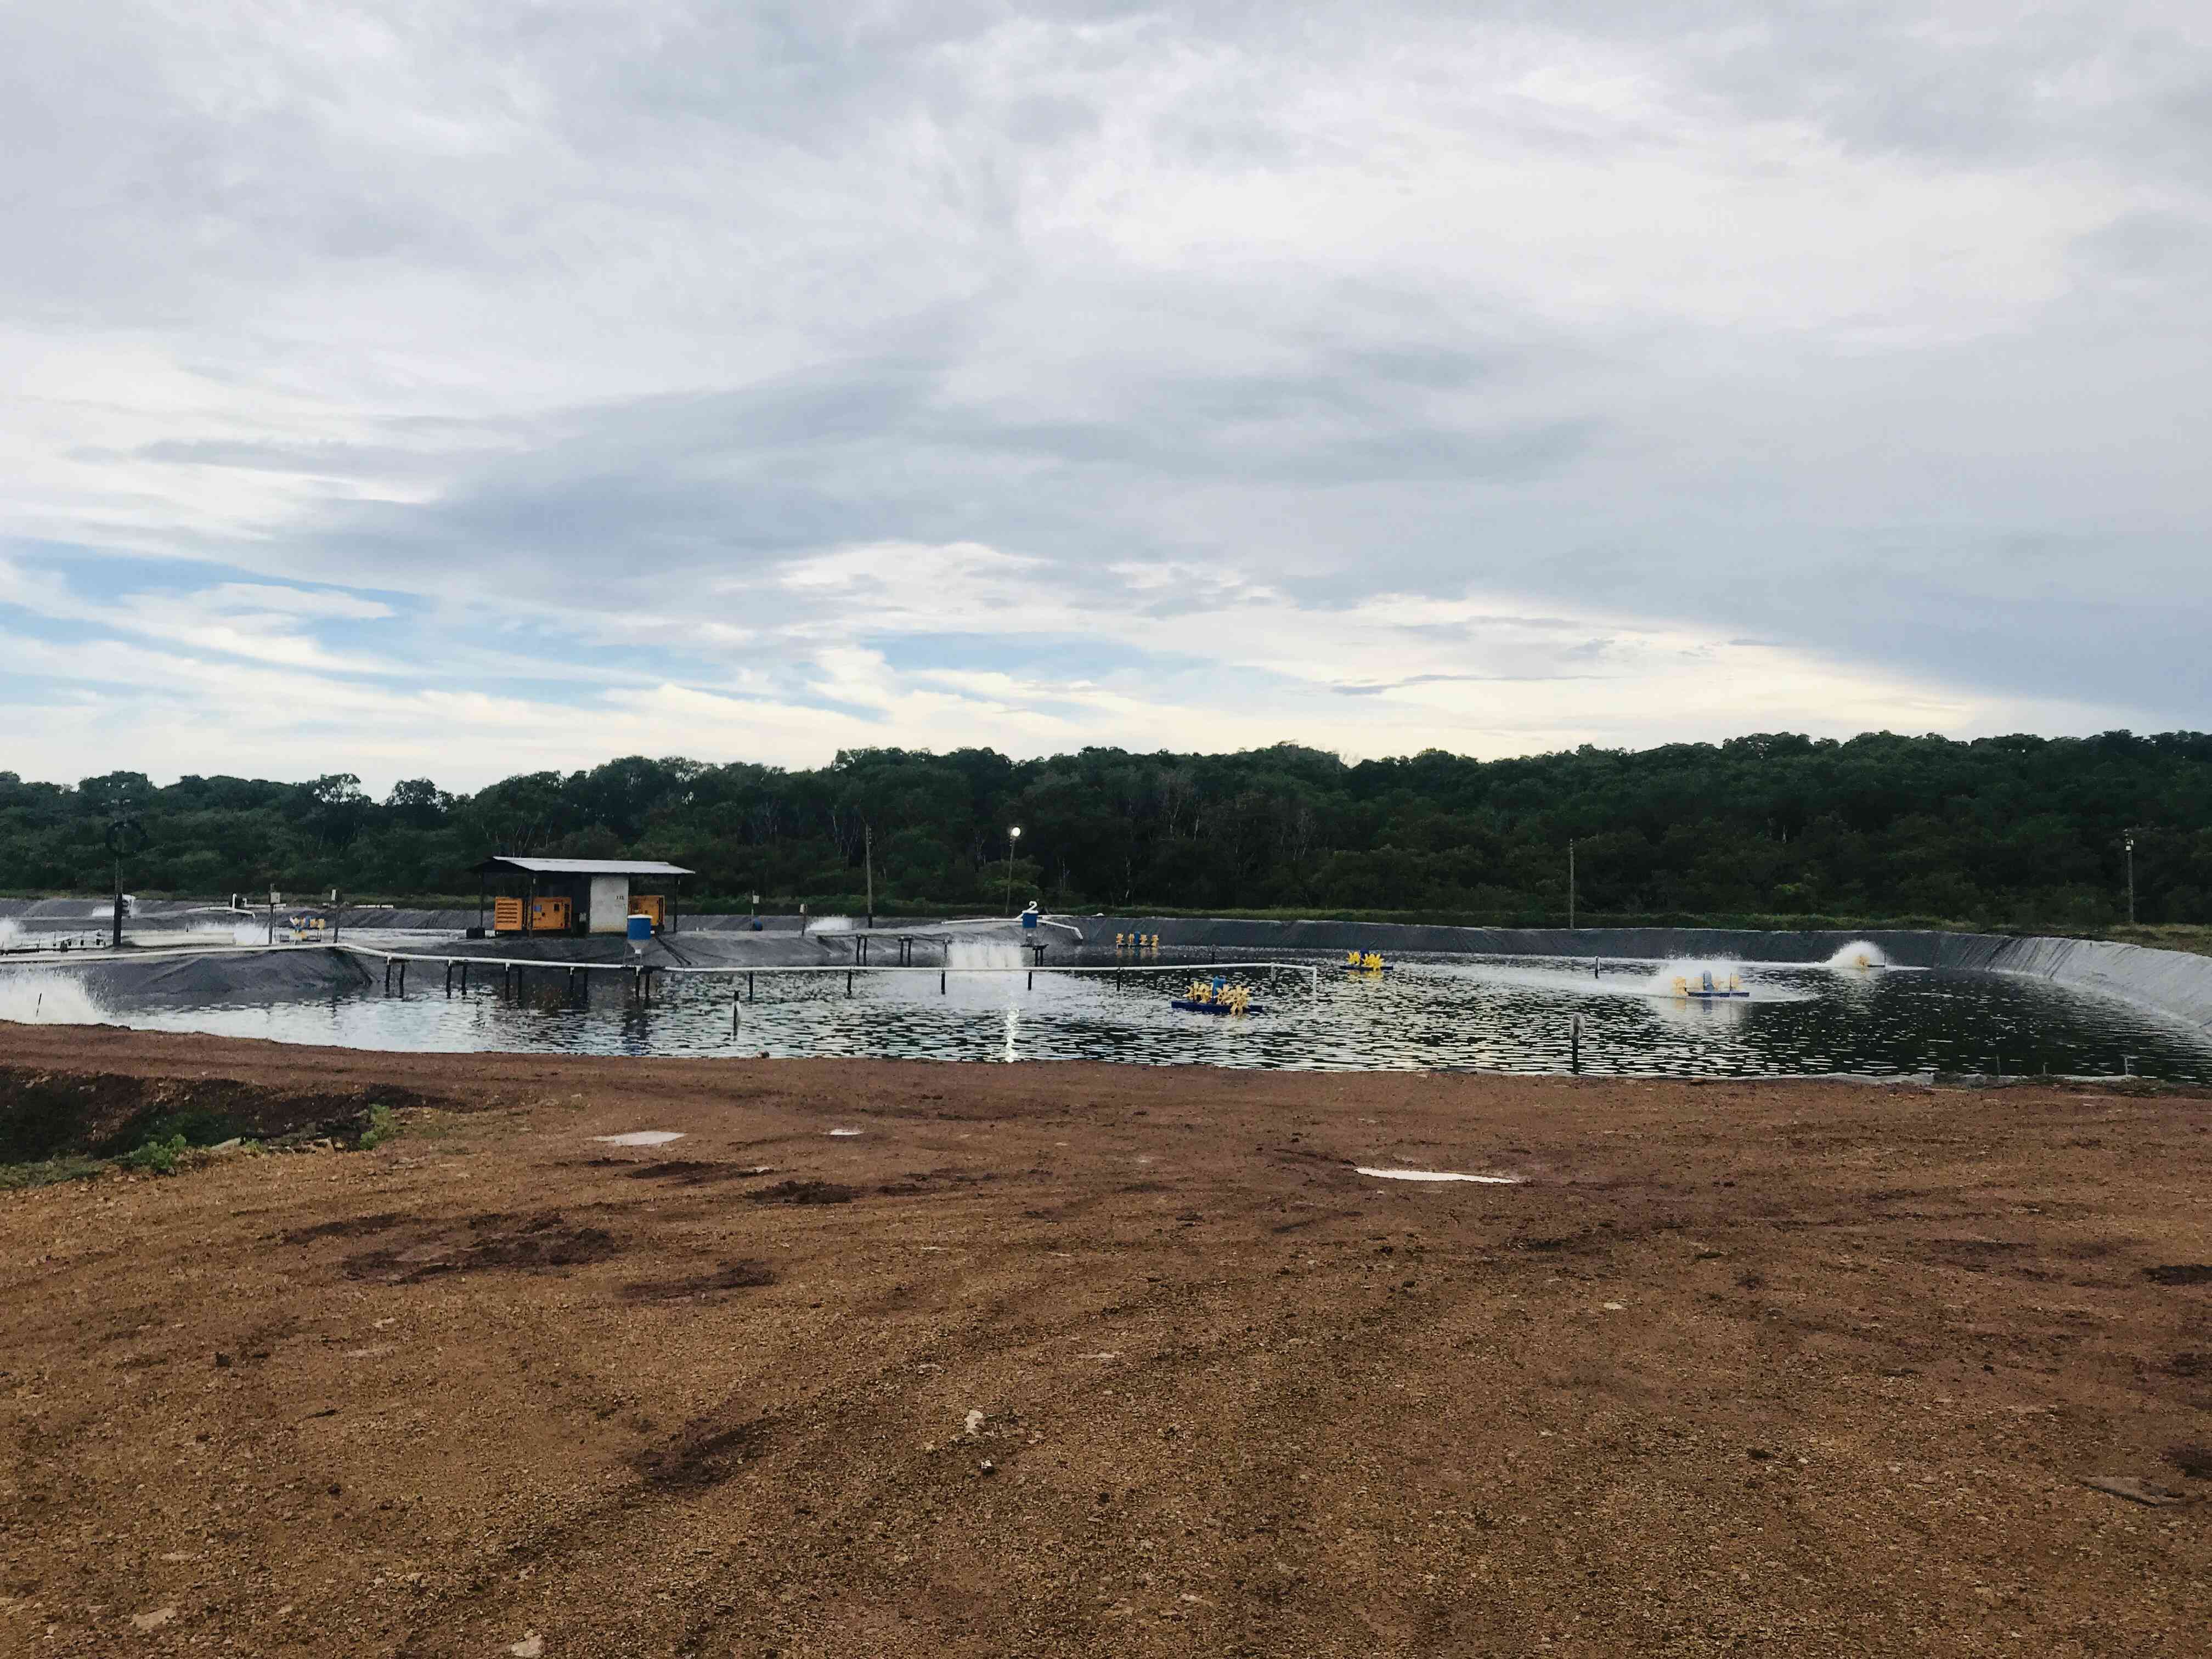
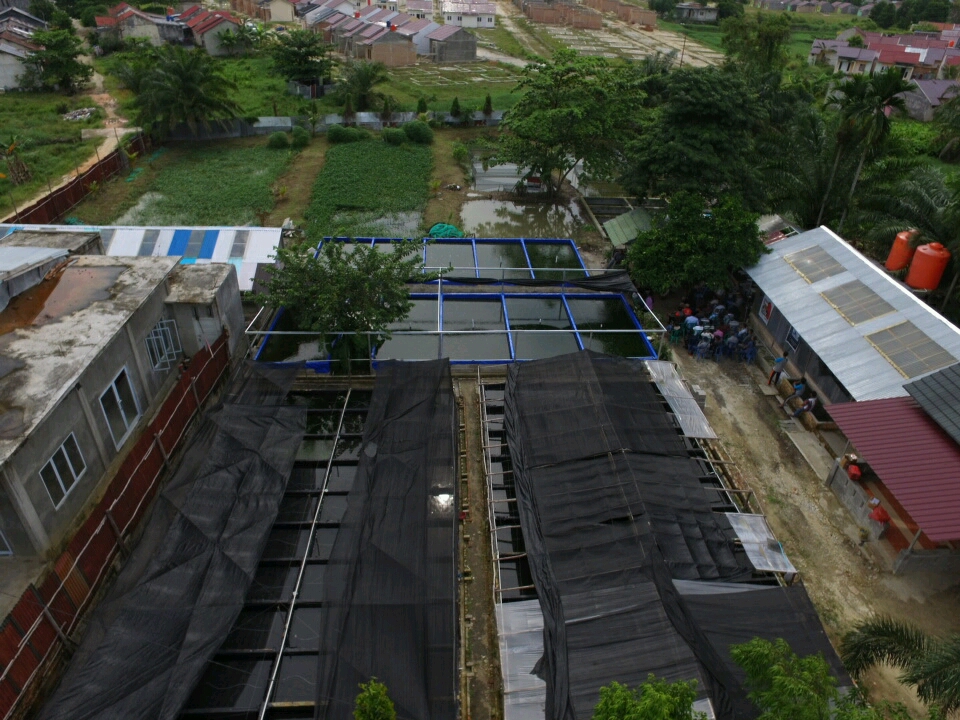
Production costs in the Pangasius farming business can be adjusted to the needs desired by the breeder or business actor. For more details, you can see an example of the results of the analysis of the business costs of Pangasius farming based on data researched in Talang Kelapa District, Banyuasin Regency.
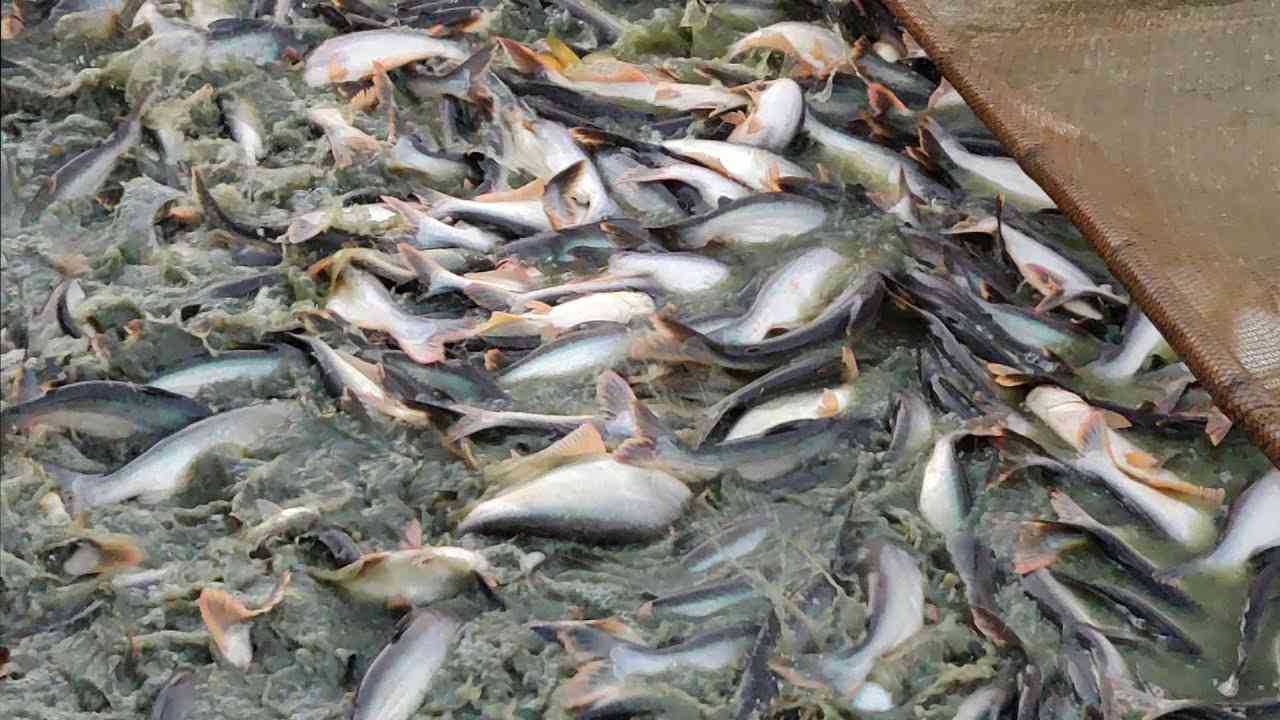
Table 1. Analysis of the enlargement of Pangasius sp.
|
|
|
||||
|
|
|
|
|
|
|
|
|
|
|
|
|
|
|
|
|
|
|
|
|
|
|
|
|
|
|
|
|
|
|
|
|
|
|
|
|
|
|
|
|
|
|
|
|
|
|
|
|
|
|
|
|
|
|
|
|
|
|
|
|
|
|
|
|
|
|
|
|
|
|
|
|
|
|
|
|
|
|
|
|
|
|
|
Currency: Indonesian rupiah (IDR)
In conclusion, the costs required include:
• Investment costs range from IDR 18,307,500 to IDR 37,091,875.
• Fixed costs range from IDR 484,667-IDR 1,527,083.
• Variable costs in the range of IDR 49,733,750-IDR 163.878.750/cycle.
• Revenue between IDR 87.300.000-IDR 235,212,500/cycle.
• The income earned is in the range of IDR 18,537,633-IDR 69,806.666/cycle.
• R/C ratio analysis value is more than 1.
• B/C ratio more than 0.
• Production BEP value is between 3,315.58 kg-10,943.46 kg.
• BEP prices range from IDR 8,537.17-IDR 11,442.24 to make a profit and not to lose (break-even point).